
September 25, 202511 min read
Equity Advisor Duties: A Simple Guide for Indian Founders
By Abhishek Bhanushali
Finance Advice

Ravi thought his electronics trading business was thriving. Sales had grown 40% in six months, orders were pouring in, and his team was expanding. Then his biggest supplier demanded immediate payment while his largest customer delayed their invoice by 60 days. Suddenly, he couldn't meet payroll.
The problem wasn't his business model; it was his blind spot. Like many founders, Ravi focused on revenue growth while ignoring the financial metrics that actually determine survival.
India's 63 million MSMEs employ 111 million people and contribute nearly 29% to the country's GDP. In the trading sector, specifically, these businesses account for 40% of the country's exports. Yet studies show that over 60% of SME failures stem not from lack of customers or market demand, but from poor financial visibility and cash flow management.
Understanding the key financial metrics for SME trading is about building financial intelligence. This intelligence often distinguishes businesses that scale sustainably from those that fail despite early success.
Cash flow is the most critical finance metric for trading SMEs because it measures the actual lifeblood of your business. The money is moving in and out of your accounts. While profit tells you if your business model works on paper, cash flow tells you if you can keep the doors open tomorrow.
The harsh reality is that 82% of businesses that fail had positive profit margins when they closed. The killer wasn't a lack of demand or poor products. It was cash flow mismanagement.
In trading businesses, especially, this risk amplifies because you're constantly managing the gap between buying inventory and collecting from customers.
Beyond basic tracking, sophisticated founders use cash flow forecasting to stay ahead of problems:
Rolling 13-Week Cash Flow Forecasts: Project cash inflows and outflows weekly for the next quarter. This gives you enough lead time to secure additional funding or adjust operations before hitting a crisis.
Scenario Planning: Model your cash flow under three scenarios—optimistic (120% of expected sales), realistic (100%), and pessimistic (70% of expected sales). This reveals how much buffer you need and when to trigger contingency plans.
Cash Conversion Cycle Optimization: Track the days it takes to convert inventory purchases into collected cash. Reducing this cycle from 90 to 60 days can dramatically improve your working capital position.
Here are a few steps to consider for streamlining your cash flow.
Accelerate Receivables Collection:
Optimize Inventory Levels:
Strategic Payables Management:
Effective cash flow management is all about establishing predictable financial rhythms that support informed decision-making and sustainable growth.
In India's competitive trading landscape, where MSMEs operate on notoriously thin margins, understanding profitability at a granular level separates successful founders from those who simply stay busy.
Your margins reveal not just whether you're making money, but whether your business model can scale profitably.
Most trading SMEs track overall gross margin, but this misses critical insights. The founders who scale successfully track margins by product line, customer segment, and even individual transactions. This granular view reveals which parts of your business actually drive profits and which are draining resources.
Product-Level Margin Analysis:
Customer Segment Profitability:
Competing on price alone is a race to the bottom. The most successful trading SMEs use value-based pricing strategies that protect margins while building customer loyalty:
Market Positioning Strategy:
Dynamic Pricing for Market Conditions:
Bundle and Tier Strategy:
The best trading SMEs don't just cut costs—they optimize cost structure to support scaling:
Variable Cost Optimization:
Fixed Cost Leverage:
Understanding and actively managing your margins isn't just about today's profitability—it's about building a business model that gets stronger and more profitable as it grows.
Liquidity ratios serve as your business's financial immune system, detecting threats before they become terminal. For trading SMEs, where cash cycles can be unpredictable and seasonal demands intense, these metrics provide the early warning system that prevents catastrophic cash shortages.
While most founders know the current ratio (current assets ÷ current liabilities), sophisticated financial management requires deeper analysis:
Industry-Adjusted Benchmarks:
Liquidity Stress Testing: Run monthly scenarios asking: "What if our top customer delays payment by 30 days?" or "What if we need to purchase emergency inventory?" These stress tests reveal whether your liquidity buffers are adequate for real-world disruptions.
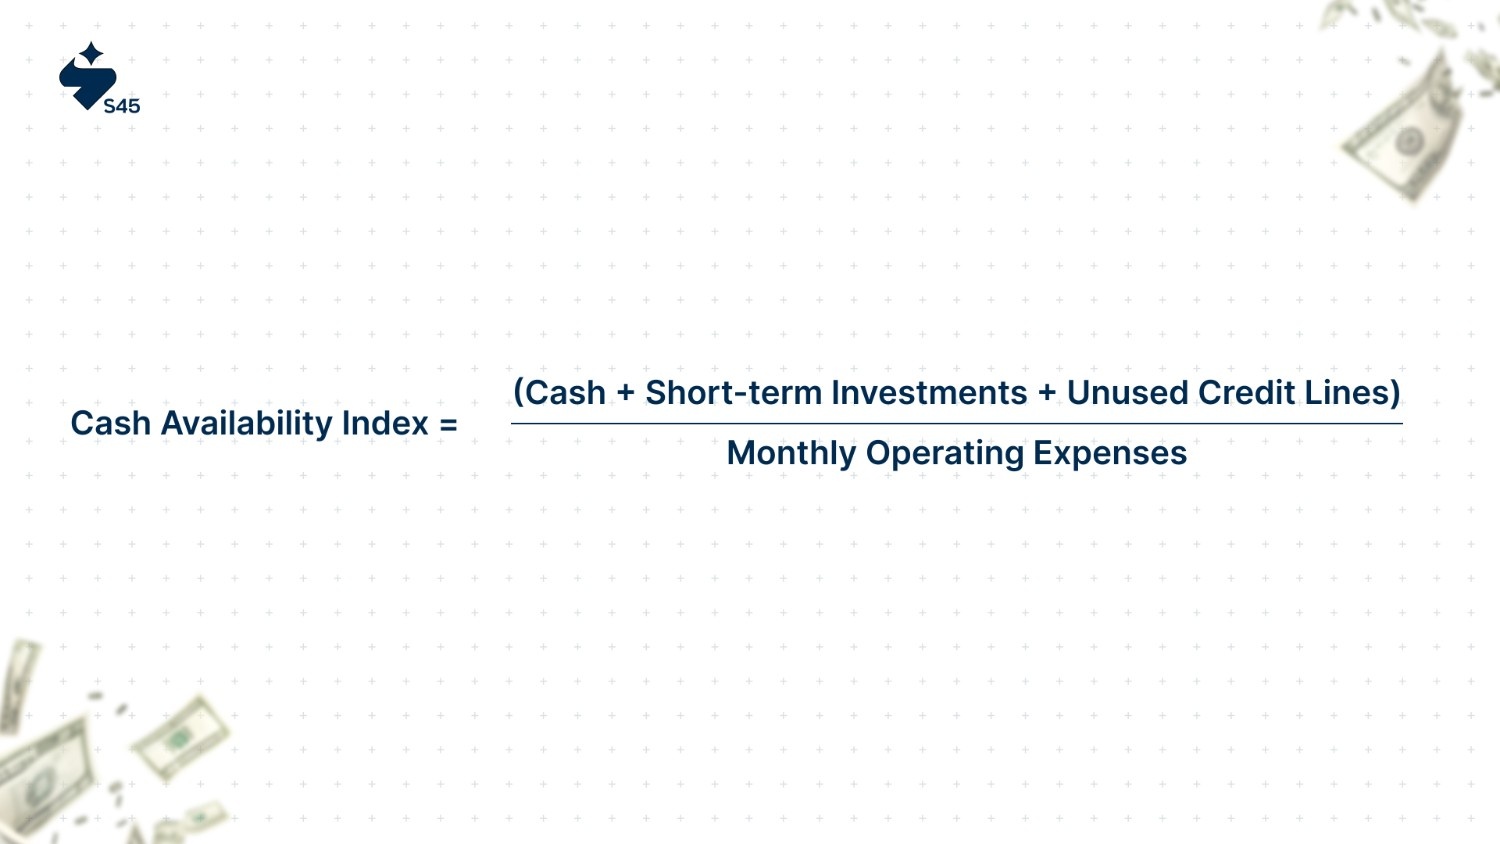

This index indicates the number of months you can operate without additional cash inflows. SMEs should maintain a CAI of at least 3-4 months to handle seasonal fluctuations and make informed growth investments confidently.
The most successful SMEs treat liquidity as a strategic asset, not just a safety net.
Your liquidity strategy should balance three key elements: immediate cash access, diversified funding sources, and optimal capital allocation. This means maintaining enough liquid assets to handle operational disruptions while avoiding the opportunity cost of holding excessive idle cash.
Credit Line Optimization:
Strategic Cash Reserves:
Strong liquidity management isn't about hoarding cash—it's about creating the financial flexibility that allows you to seize opportunities and weather storms without compromising your long-term vision.
Debt, when used strategically, accelerates growth and competitive positioning. When mismanaged, it becomes the constraint that limits every business decision. The most successful trading SMEs view debt as a tool for building competitive advantages, not just solving cash problems.
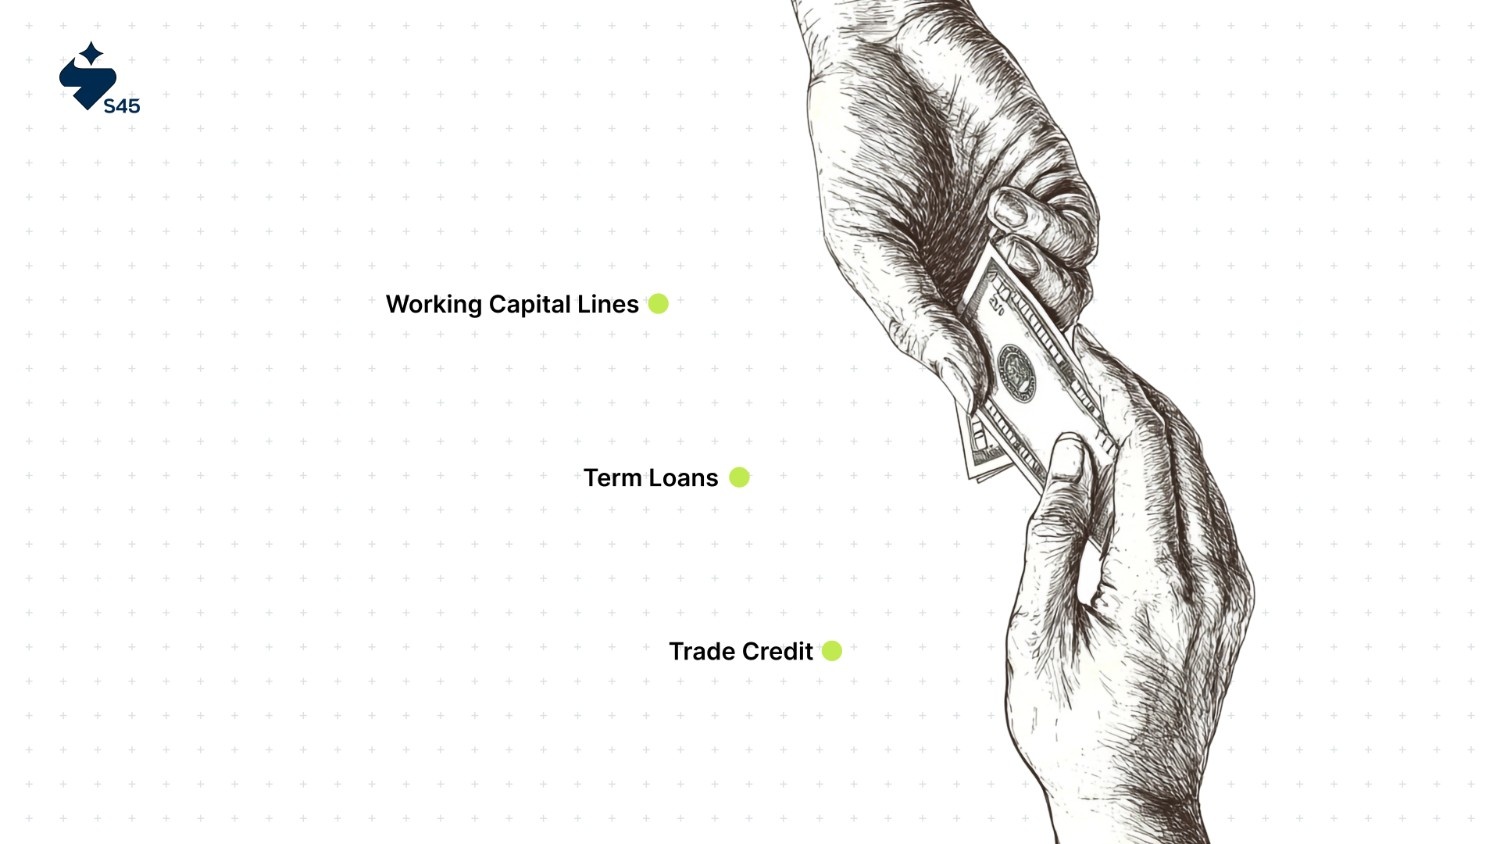
The key to understanding the strategic debt framework is that not all debt serves the same purpose or carries the same risk profile for your trading business.
Successful trading SMEs approach debt with a clear framework that categorizes borrowing by strategic purpose, matches debt terms to business needs, and ensures debt supports rather than constrains their growth vision. This strategic approach helps you avoid the common trap of taking on debt reactively during crises and instead positions debt as a tool for competitive advantage.
Growth Debt vs. Survival Debt:
When to Leverage Up:
When to Deleverage:
The goal isn't minimizing debt—it's optimizing debt structure to support your vision of sustainable, profitable growth while maintaining control of your business destiny.
Working capital management separates amateur traders from professional operators. Your inventory and receivables aren't just assets on a balance sheet—they're either engines of growth or anchors dragging down your cash flow and profitability.
For trading SMEs, smart inventory management isn’t just about stock levels, it’s about turning inventory into working capital efficiency. Applying intelligence to high-value items, seasonal demand, and dead stock ensures profits aren’t locked up on the shelves.
The 80/20 Inventory Rule: Track which 20% of your products generate 80% of your profits. These "A-category" items deserve premium inventory management:
Seasonal Inventory Modeling: Create predictive models for seasonal demand patterns. Successful trading SMEs plan inventory purchases 3-4 months ahead, securing better supplier terms and avoiding last-minute premium pricing during peak seasons.
Dead Stock Early Warning System: Implement automatic alerts when inventory items haven't moved in 60 days. Quick action on slow-moving stock (through bundling, discounting, or returning to suppliers) prevents cash from getting trapped in worthless inventory.
Receivables are a source of competitive advantage when managed strategically. By analyzing customer payment behavior, tightening collection processes, and using receivables data to guide growth decisions, trading SMEs can protect cash flow while scaling sustainably.
Customer Payment Behavior Analytics: Track payment patterns by customer to identify early warning signs:
Proactive Collection Strategies:
Receivables as Growth Leverage: Use your receivables data to make smarter growth decisions:
Optimizing the working capital cycle is about accelerating cash flow without straining relationships. For trading SMEs, tighter control over payables, receivables, and inventory creates the liquidity needed for steady growth and market agility.
Measuring Your Cash Conversion Cycle: Track the days from when you pay suppliers to when you collect from customers. Industry-leading trading SMEs achieve cycles of 45-60 days, while struggling businesses often exceed 120 days.
Cycle Improvement Strategies:
Optimizing working capital isn't about squeezing suppliers or customers—it's about creating financial rhythms that support predictable growth and give you the flexibility to seize market opportunities.
In today's competitive landscape, the trading SMEs that scale successfully are those that treat marketing as an investment requiring precise measurement and optimization. Understanding the financial returns of your customer acquisition efforts is crucial for sustainable growth.
Looking beyond basic CAC helps trading SMEs understand whether new customers truly create long-term value. By focusing on lifetime profitability, not just acquisition costs, businesses can ensure every rupee spent on growth compounds into sustainable returns.
Customer Lifetime Value (CLV) Modeling: Calculate the total profit you'll earn from a customer over their entire relationship with your business. For trading SMEs, this includes:
The LTV: CAC Ratio is essential. Target an LTV: CAC ratio of at least 3:1 for sustainable growth.
If you're acquiring customers for ₹5,000 but they only generate ₹10,000 in lifetime profit, you're in dangerous territory. The most successful trading SMEs achieve 5:1 or higher ratios.
Not all marketing channels deliver the same quality of customers. For trading SMEs, tracking ROI at the channel and geographic level reveals where acquisition spend drives the highest lifetime value, helping prioritize efforts that maximize growth efficiency.
Digital vs. Traditional Channel Performance:
Geographic ROI Analysis:
Deciding when to increase or optimize marketing investment is one of the toughest calls for growing businesses. Spend too early, and you burn cash without returns. Scale too late, and competitors capture market share. A clear framework based on financial metrics and channel performance ensures that every rupee invested compounds growth rather than drains resources.
The decision comes down to balancing customer lifetime value (LTV), acquisition costs (CAC), and payback timelines—while maintaining visibility into which channels truly deliver high-quality customers.
When to Scale Marketing Spend:
When to Optimize Before Scaling:
The goal isn't minimizing marketing costs—it's maximizing the return on every rupee invested in growth while building a sustainable customer acquisition engine.
Revenue isn't just a number—it's a story about your business's health, market position, and growth potential. The most successful trading SME founders develop the ability to read revenue patterns like a doctor reads vital signs, detecting opportunities and threats long before they become obvious.
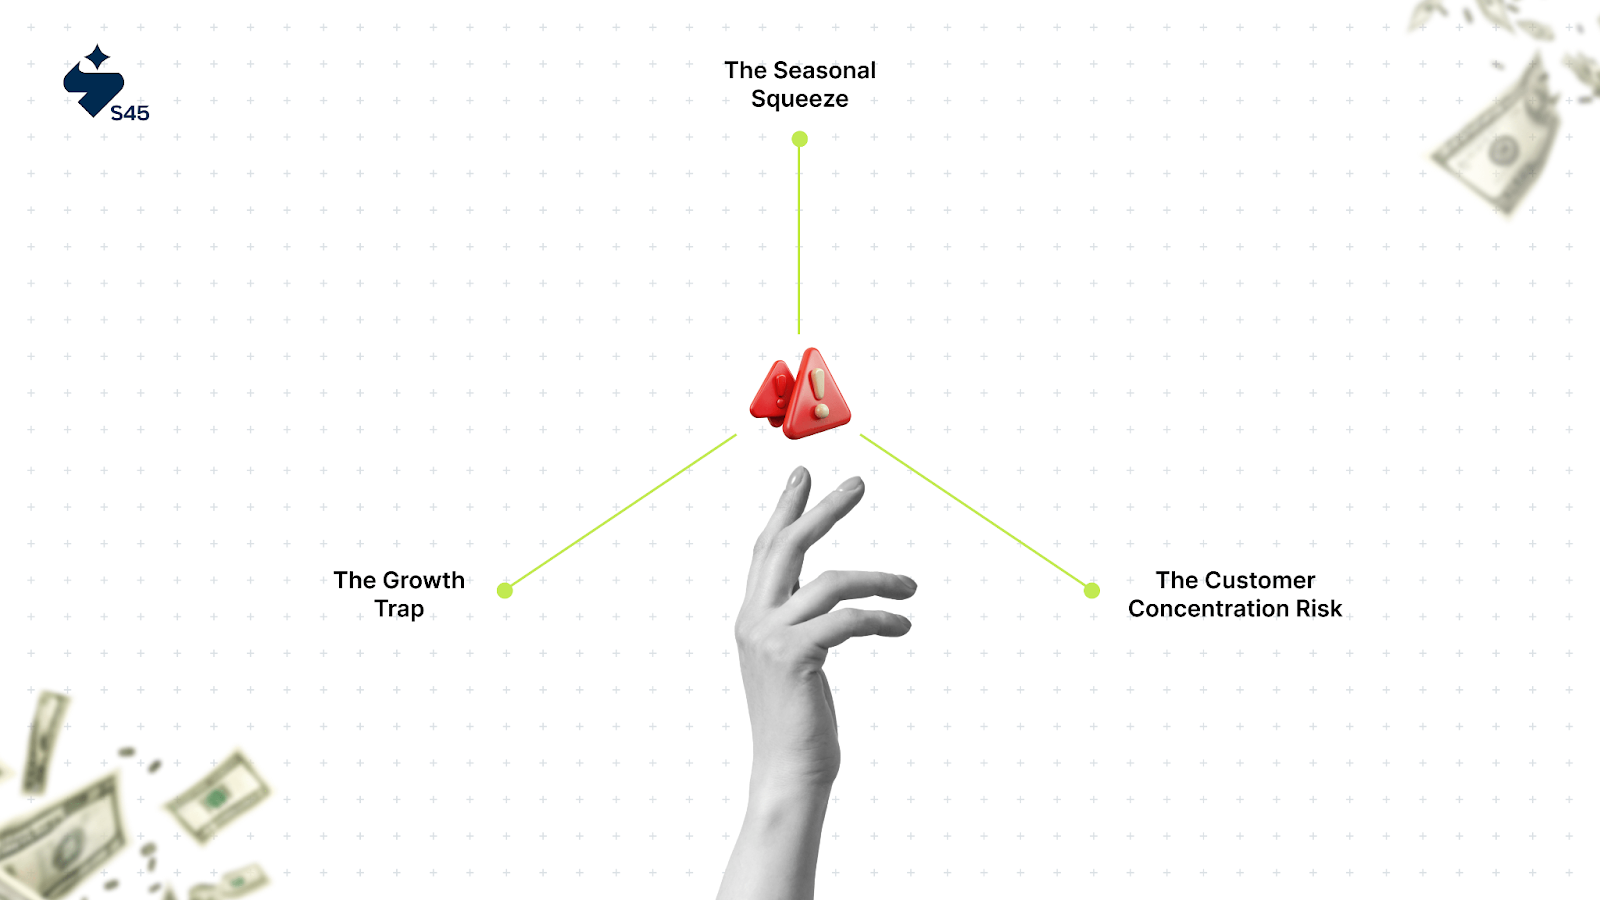
High revenue alone doesn’t guarantee business stability—what matters is its quality. For trading SMEs, assessing revenue concentration, predictability, and product evolution helps reduce risk, strengthen resilience, and guide smarter growth decisions.
Revenue Concentration Risk:
Revenue Predictability Score: Create a monthly metric combining:
Product Revenue Evolution:
Not all growth is good growth. For trading SMEs, recognizing the difference between sustainable growth patterns and warning signs ensures that expansion strengthens profitability instead of masking underlying weaknesses.
Sustainable vs. Unsustainable Growth Indicators:
Knowing the difference helps trading SMEs double down on profitable growth while avoiding patterns that erode long-term stability.
Healthy Growth Signals:
Warning Signs in Revenue Trends:
Accurate revenue forecasting is the foundation of strategic planning. For trading SMEs, combining internal performance data with external market intelligence enables realistic projections that guide smarter investments and reduce financial surprises.
Bottom-Up Revenue Modeling: Build revenue forecasts by combining:
Market Intelligence Integration:
Revenue intelligence helps you make proactive decisions about inventory, hiring, and growth investments rather than reacting to problems after they develop.
Every experienced founder encounters the frustrating scenario where their financial metrics tell different stories. Cash flow might be tight while profits look strong, or margins might be healthy while growth stalls. Learning to diagnose and resolve these conflicts is a critical skill for sustainable scaling.
Financial metrics don’t always tell the same story. For trading SMEs, conflicts between profit, cash flow, and growth often reveal deeper structural issues, understanding these mismatches is key to fixing root causes before they become crises.
Profitable But Cash-Poor: This classic SME challenge usually stems from:
Strong Cash Flow But Declining Margins: This often indicates:
A structured financial health checkup helps trading SMEs spot vulnerabilities early and course-correct before they escalate. By regularly reviewing cash, margins, growth sustainability, and risk concentration, businesses can ensure long-term stability while pursuing growth.
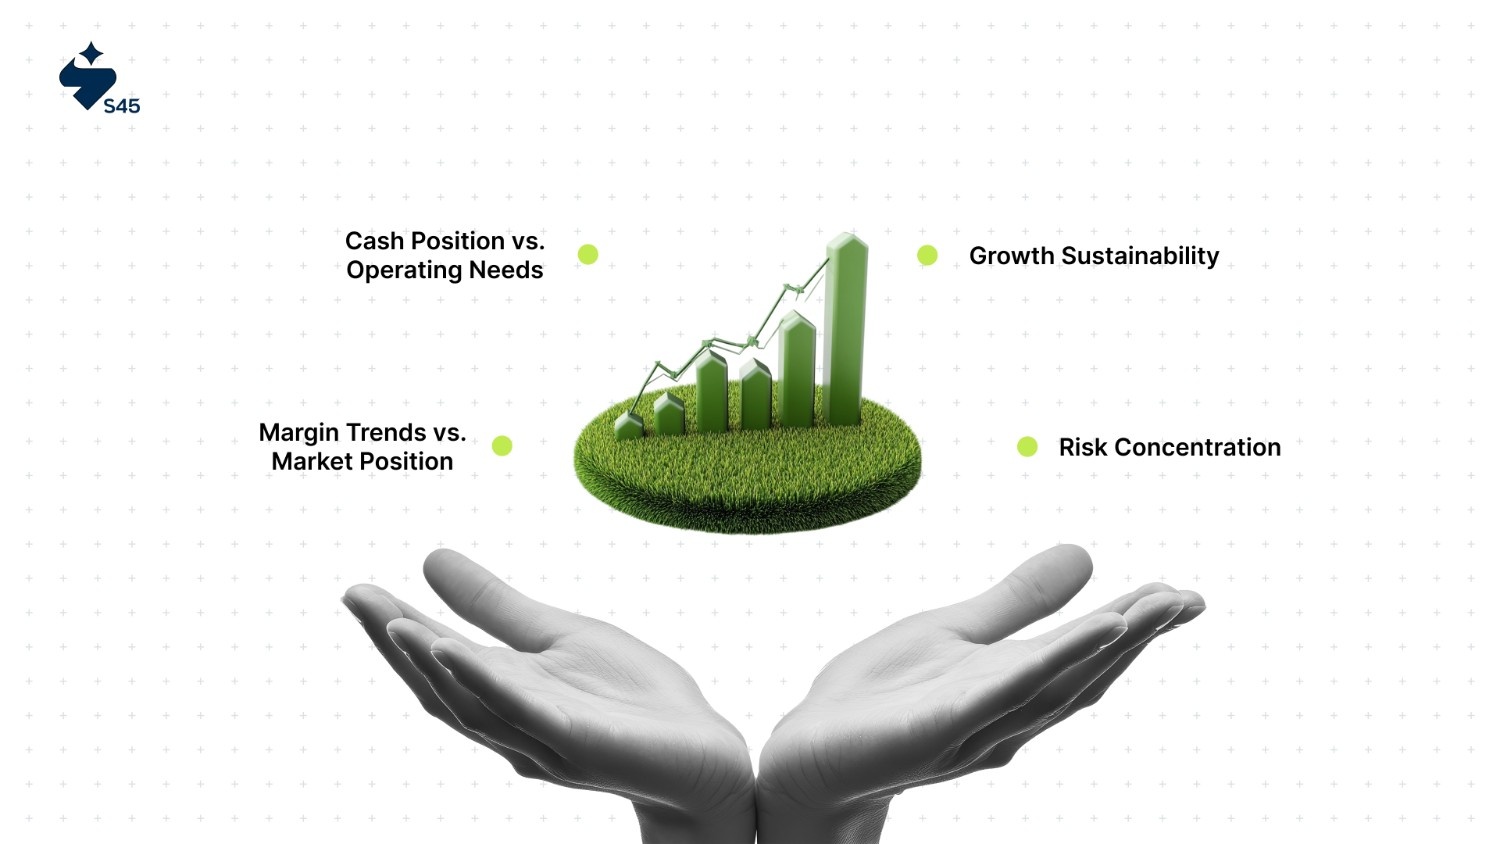
Quarterly Strategic Review:
When financial metrics conflict, the solution isn’t choosing one over the other. It’s resolving the imbalance. For trading SMEs, targeted strategies can align profit, cash flow, and growth so the business stays both stable and scalable.
When Cash Lags Profit:
When Margins Decline Despite Revenue Growth:
The key is developing the pattern recognition to spot conflicts early and the operational discipline to address root causes rather than just symptoms.
The trading SMEs that scale most successfully are those that leverage technology to transform financial tracking from a manual burden into an automated competitive advantage. The right tech stack doesn't just save time—it provides insights that manual tracking can't match.
The right technology backbone gives trading SMEs real-time financial visibility and tighter control over growth-critical metrics.
Integrated Financial Management Platforms: Modern cloud-based accounting systems like Zoho Books, Tally Prime, or QuickBooks India provide real-time visibility into all key metrics. Look for platforms that integrate with your inventory management and e-commerce systems to eliminate manual data entry and reduce errors.
Automated Dashboard Solutions:
Standard financial reports aren’t enough for trading SMEs. Custom metric tracking ensures leaders see the right data at the right time. A unified dashboard turns raw numbers into actionable insights for faster, smarter decisions.
Building Your Financial Command Center: Create a single dashboard that displays:
Automated Insights Generation:
The investment in financial technology typically pays for itself within 6-12 months through improved cash flow, reduced bad debt, and better inventory management.
The founders who succeed in India's competitive trading landscape share one critical trait: they view financial management not as a compliance requirement but as a strategic advantage. They use metrics to spot opportunities others miss, avoid traps that destroy competitors, and make decisions based on data rather than intuition alone.
The most successful trading SME founders don't track these metrics in isolation. They understand that financial excellence comes from combining robust systems with strategic guidance and peer learning from others who've navigated similar challenges.
Join the S45 Club and connect with a community of founders who understand that great businesses are built on great financial foundations. Talk to the experts here!
Cash flow measures actual money movement, while profit is accounting-based and includes unpaid sales. In trading, you need real cash to buy inventory and pay suppliers. Profitable businesses fail when they can't access the cash needed for operations.
Trading SMEs should maintain a current ratio between 1.5-2.5. Lower ratios indicate potential liquidity stress, while much higher ratios suggest inefficient use of capital. The exact target depends on your industry, seasonality, and growth stage.
Cash flow should be monitored weekly, margins monthly, and strategic metrics like debt ratios quarterly. However, during rapid growth or market stress, increase the frequency of daily cash flow monitoring and weekly comprehensive reviews.
Most successful trading SMEs maintain debt-to-equity ratios between 0.5-1.5. Ratios below 0.5 might indicate under-leveraging growth opportunities, while ratios above 2.0 suggest potential overleveraging. The key is ensuring debt supports growth rather than just covering operating shortfalls.
Track Customer Acquisition Cost (CAC) and Customer Lifetime Value (LTV) with a target LTV: CAC ratio of at least 3:1. Also, monitor payback period—trading SMEs should typically recover customer acquisition costs within 12 months due to working capital requirements.
Discover more insights on similar topics


Get startup insights and connect with our community